
Make the most out of your data
Data can be converted to real business assets. Analyzing and visualizing the data in an intuitive and meaningful way, relevant to different user categories including customers, operational team and management empowers them to make informed decisions, improve productivity, reduce errors and resource wastage. We have designed operational and CXO dashboards across multiple industries including retail, healthe care, energy management, FinTech, stock trading and Web3/DeFi.


Our Dashboard design expertise
Our Digital Dashboard Designs services will transform your raw data into highly effective visual analytics to help you gain deeper better business and operational insights visibility.
-
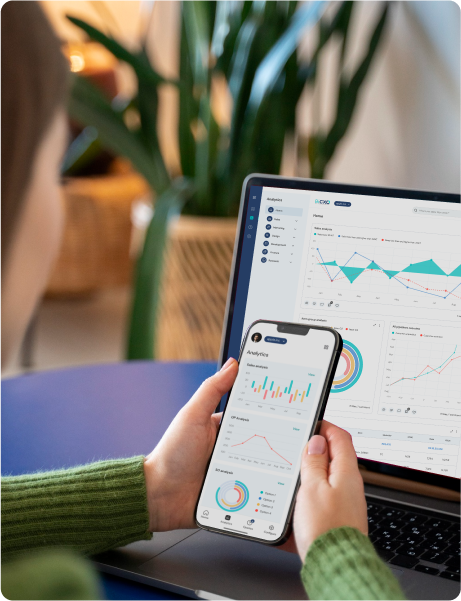
Web app dashboard design
Tailored interfaces optimized for web apps, providing comprehensive data insights and functionalities accessible across browsers.
-
Mobile dashboard design
Customized layouts specifically crafted for mobile devices, enabling users to access crucial data on-the-go, with intuitive visuals and precise insights.
-
HMI dashboard design
Interfaces designed to facilitate seamless interaction between humans and machines, presenting data in an easily comprehensible manner for real-time monitoring and control.
-
War-room dashboard design
Specialized dashboards created for high-stakes scenarios, aggregating critical data and visualizations in a single interface for rapid decision-making in time-sensitive situations
Our Dashboard design projects
Explore our array of dashboard designs, from strategic to operational and analytical dashboards, for web and mobile interfaces.

Mobile app UI UX design
StockPe: Stock market learning & trading appDesign for a Fintech platform that takes a gamified approach to make stock education and investment simple and engaging.

Ecommerce website design & UI development
Wire & Switch: Ecommerce platformDesign & development for an electrical ecommerce platform to create a seamless shopping experience & improve sales.

Web app UX UI design
IUDX: Data exchange platformWeb UI UX design for IUDX, a smart city data exchange platform under the Govt. of India to facilitate data accessing & sharing.

Mobile app UI UX design
Pebbles: Self-help appMobile app design for a journaling & goal setting platform to encourage user interactions and increase user engagement.

Mobile app design & UI development
DAMAC: Real estate agents applicationUX UI redesign and development for a leading real estate enterprise to improve their agents’ operations & communication.

SaaS UI UX design
IQnext: Building management platformCloud platform to facilitate energy, device and space management for buildings.

Web app UI UX design
Roca: Tax & legal notice management systemUI UX redesign of the tax & legal notice management system of Roca for a centralized, well-structured and simplified record management.
How do we design dashboards tailored for your needs?
Following a well defined dashboard design process helps us gather the right inputs to build a dashboard that meets your exact needs.
Define the audience and goals
What decisions do they need to make? What are their key performance indicators (KPIs)? A good understanding of the audience and goals help us identify the specific data and visualizations that will be most useful to users.
Collect and prepare the data
Once we identify what data we need, we collect it from various sources and prepare it for visualization. This may involve cleaning the data, removing outliers, and aggregating it at the appropriate level.
Choose the right visualization types
From the many visualization types available, such as charts, graphs, and maps, we choose the ones that best communicate the data and help the users take the right actions for their purpose.
Design the dashboard layout
Based on user requirements, we decide a layout by grouping related metrics together and using visual cues to help users identify the most important information quickly.
Test and iterate
We test the dashboard with users and gather feedback to identify areas of improvement and iterate the design to make necessary changes, before deploying to users.
Business Benefits of well designed digital dashboards
The raw data can be transformed to well conceived and designed dashboards, that can help you achieve:


Strong Track Record
Aufait UX's robust foundation and extensive tenure in UI/UX design demonstrate our stability, commitment, and adaptability in this dynamic industry

Winner of International Design Awards
Aufait UX has won global design awards, showcasing our excellence in creating standout user experiences.

Enviable Customer Logos
Our partnerships with global brands highlight our ability to consistently meet the diverse and exacting design needs of renowned companies.

Global Reach and Impact
Aufait UX's global reach broadens our influence. Working with clients worldwide, we excel in diverse markets.